The plugin system and API for ctext.org make it possible to import textual data from ctext.org directly into other online tools. One such tool is the new “Text Tools” plugin, which provides a set of textual analysis and visualization tools designed to work with texts from ctext.org. There is a step-by-step online tutorial describing how to actually use the tool (as well as the instructions on the tool’s own help page); I won’t repeat those here, but instead will give some examples of what the tool can be used to do.
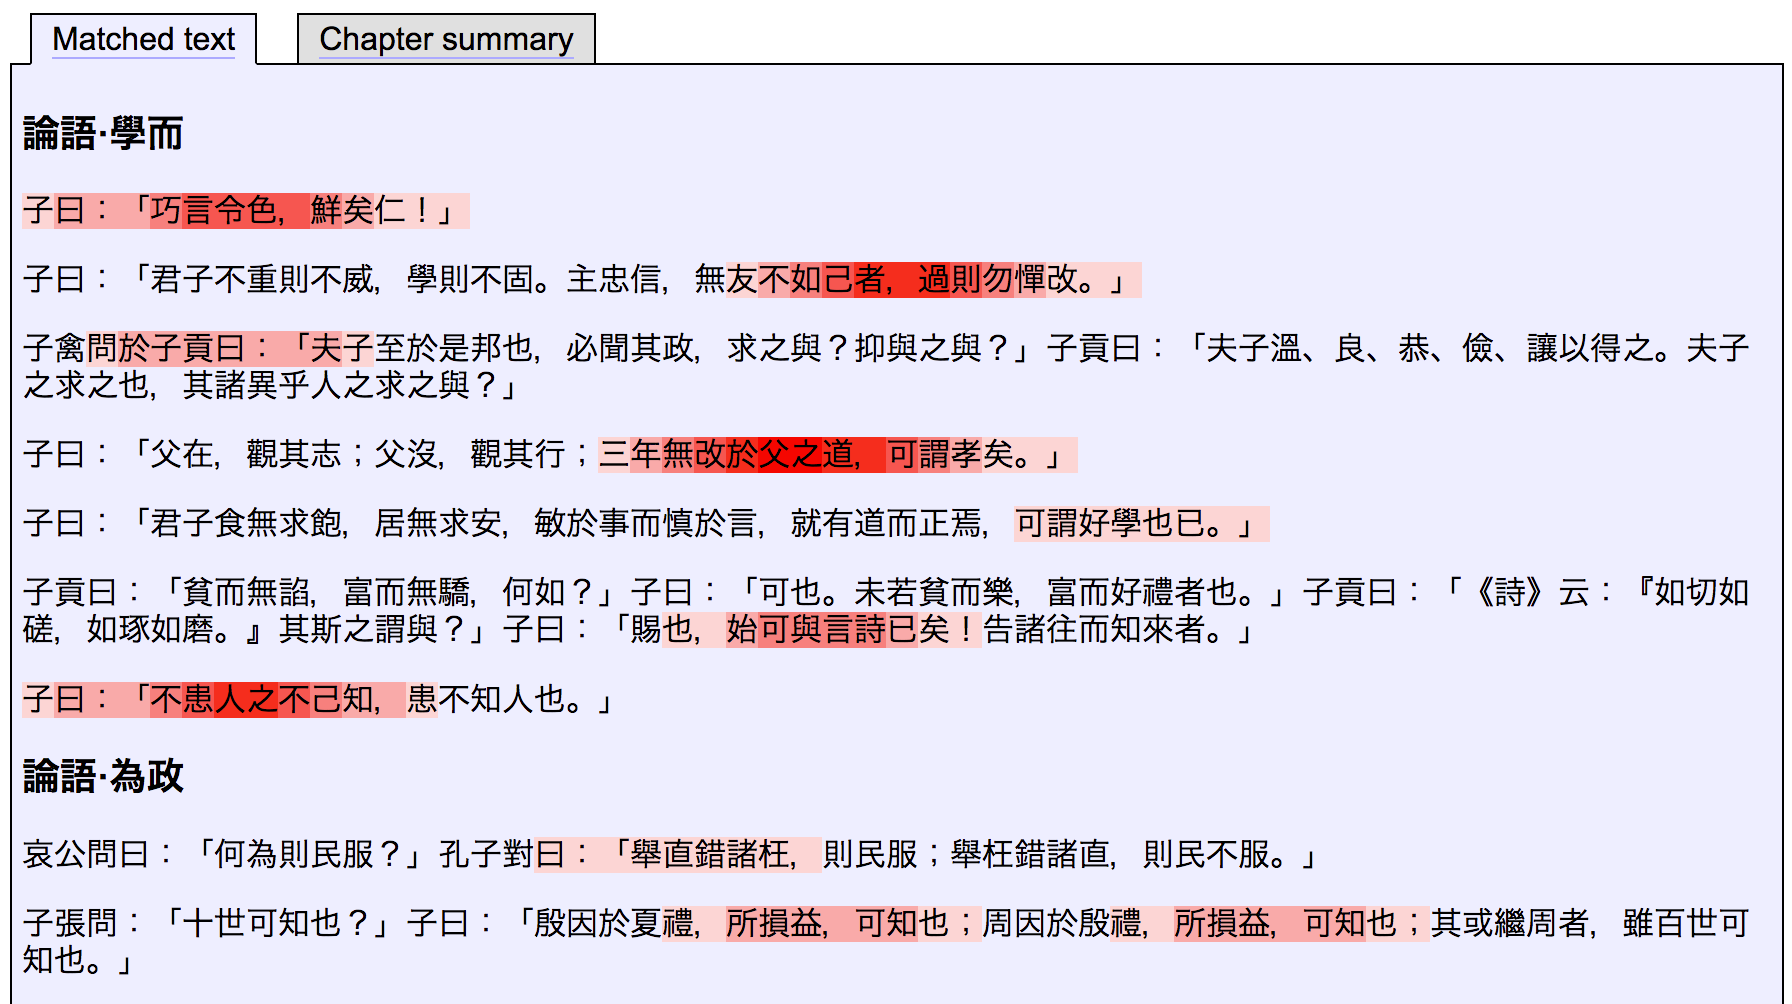
One of the most interesting features of the tool is its function to identify text reuse within and between texts (via the “Similarity” tab). This takes as input one or more texts, and identifies and visualizes similarities between them. For example, with the text of the Analects:
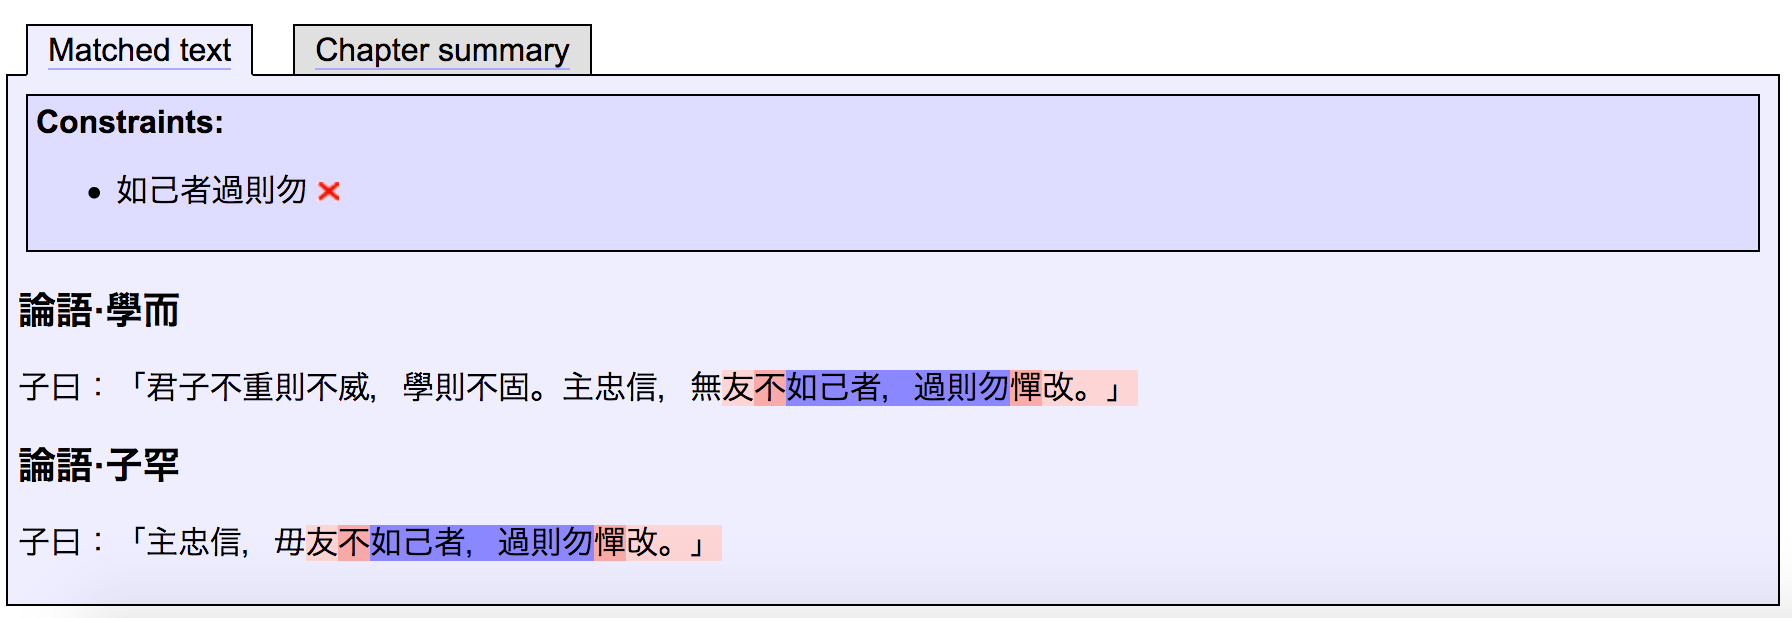
This uses a heat map effect somewhat similar to the ctext.org parallel passage feature: here n-grams are matched (e.g. 3-grams, i.e. triples of identical characters used in identical sequence), and overlapping matched n-grams are shown in successively brighter shades of red. By default, all paragraphs having any shared n-grams with anything else in the selected text or texts are shown. The visualization is interactive, so clicking on any highlighted section switches the view to show all locations in the chosen corpus containing the selected n-gram (which is then highlighted in blue, like the 6-gram “如己者過則勿” in the following image):
Since the texts are read in from ctext.org via the API, the program also knows the structure of the text; clicking on “Chapter summary” shows instead a table of calculated total matches aggregated on a chapter-by-chapter basis:
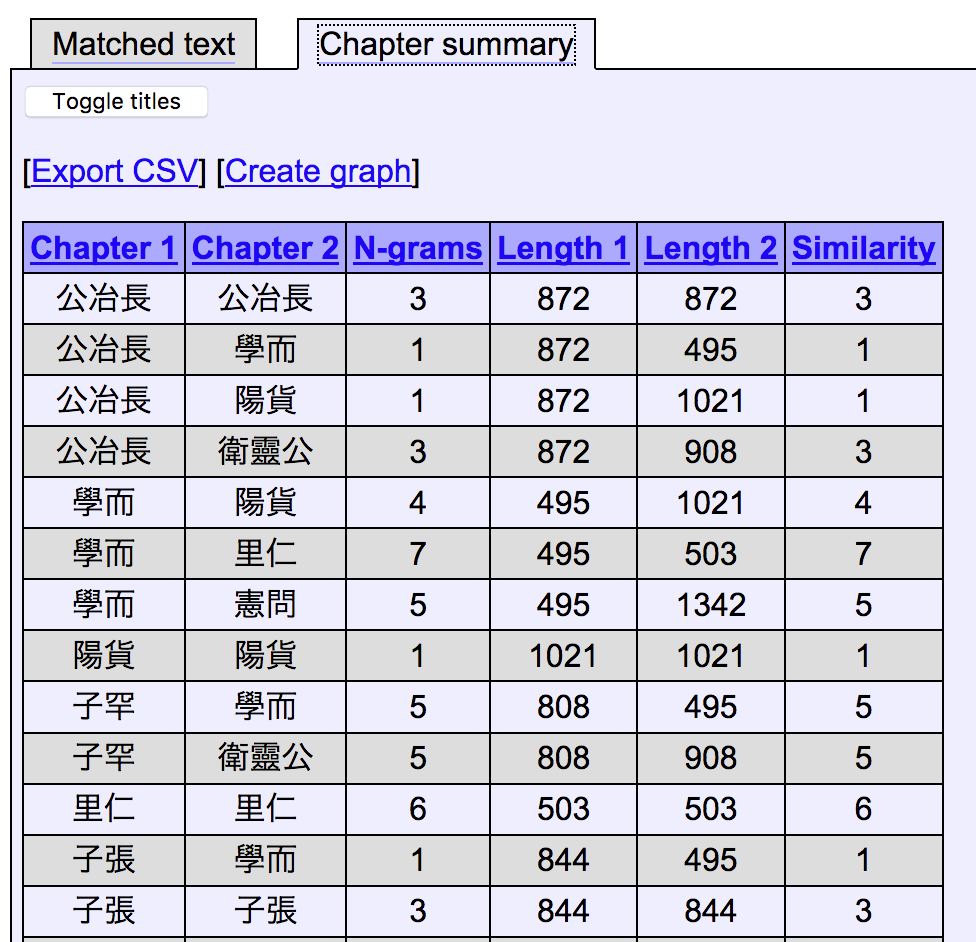
This data is relational: each row expresses strength of similarity of a certain kind between two entities (two chapters of text). It can therefore be visualized as a weighted network graph – the Text Tools plugin can do this for you:
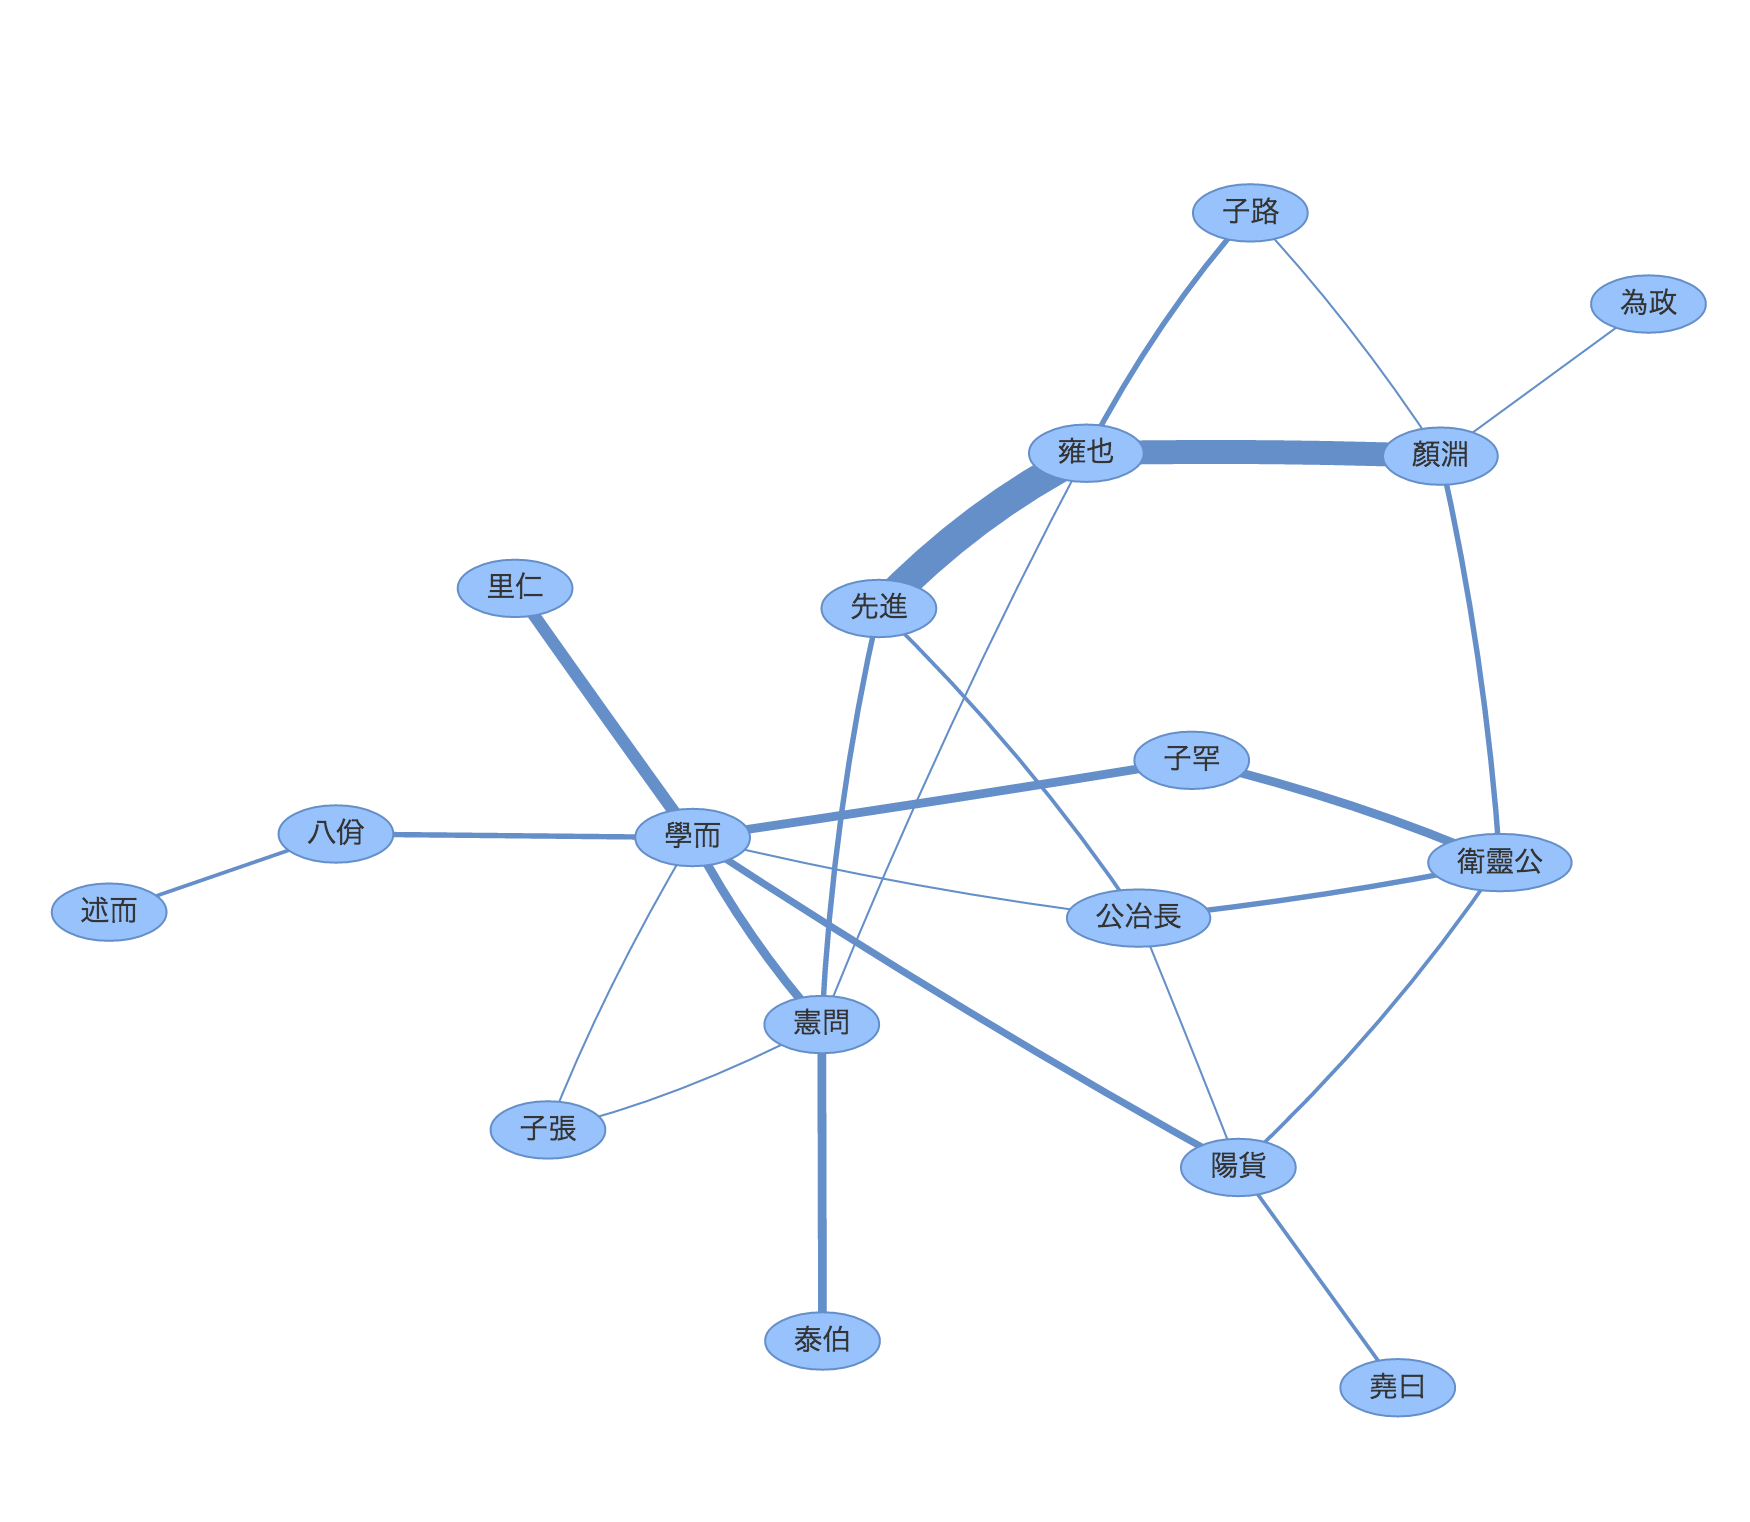
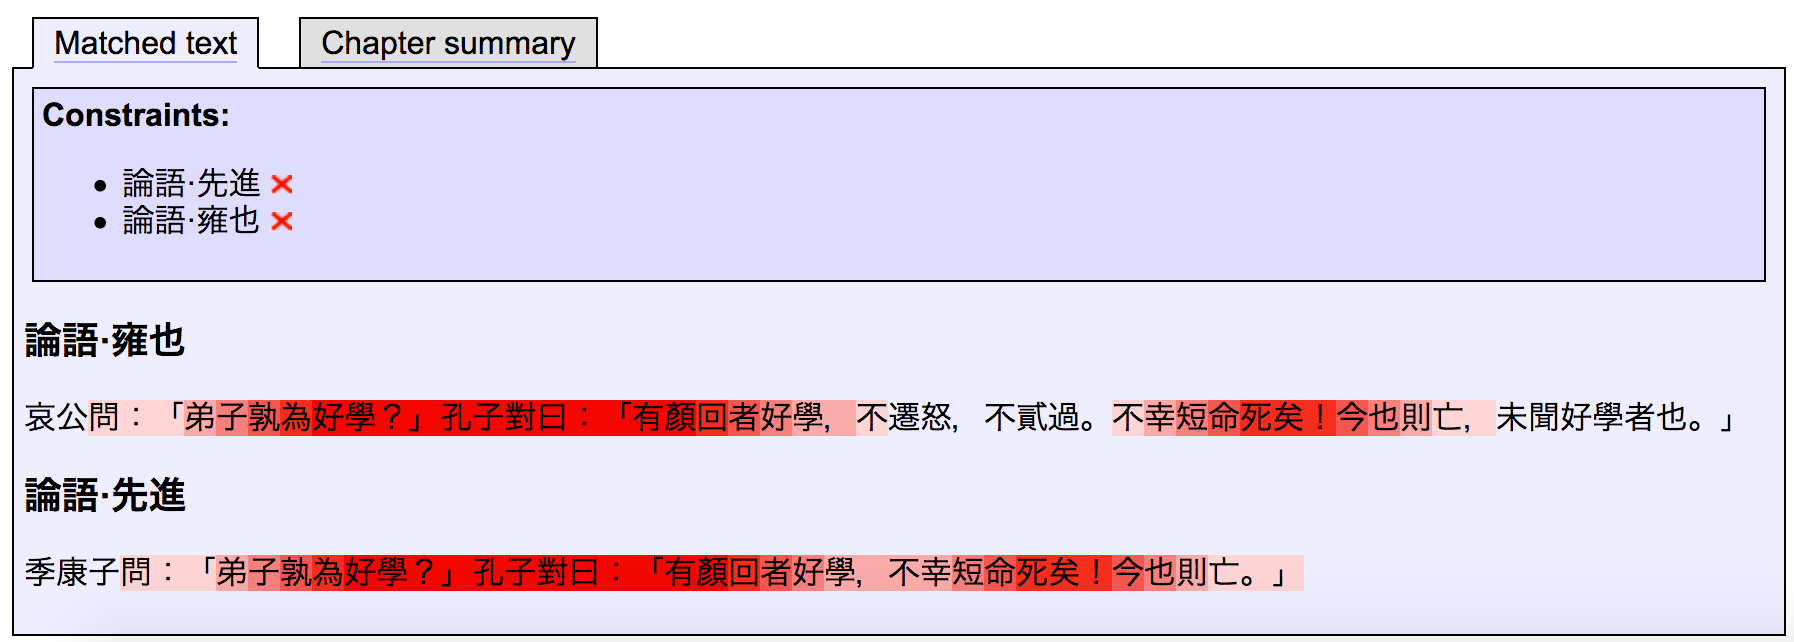
What’s nice about this type of graph is that every edge has a very concrete meaning: the edge weights are simply a representation of how much reuse there is between the two nodes (i.e. chapters) which it connects. Even better, this visualization is also interactive: double-clicking an edge (e.g. the edge connecting 先進 and 雍也) returns to the passage level visualization and lists all the similarities between those two specified chapters – in other words, it lists precisely the data forming the basis for the creation of that edge:
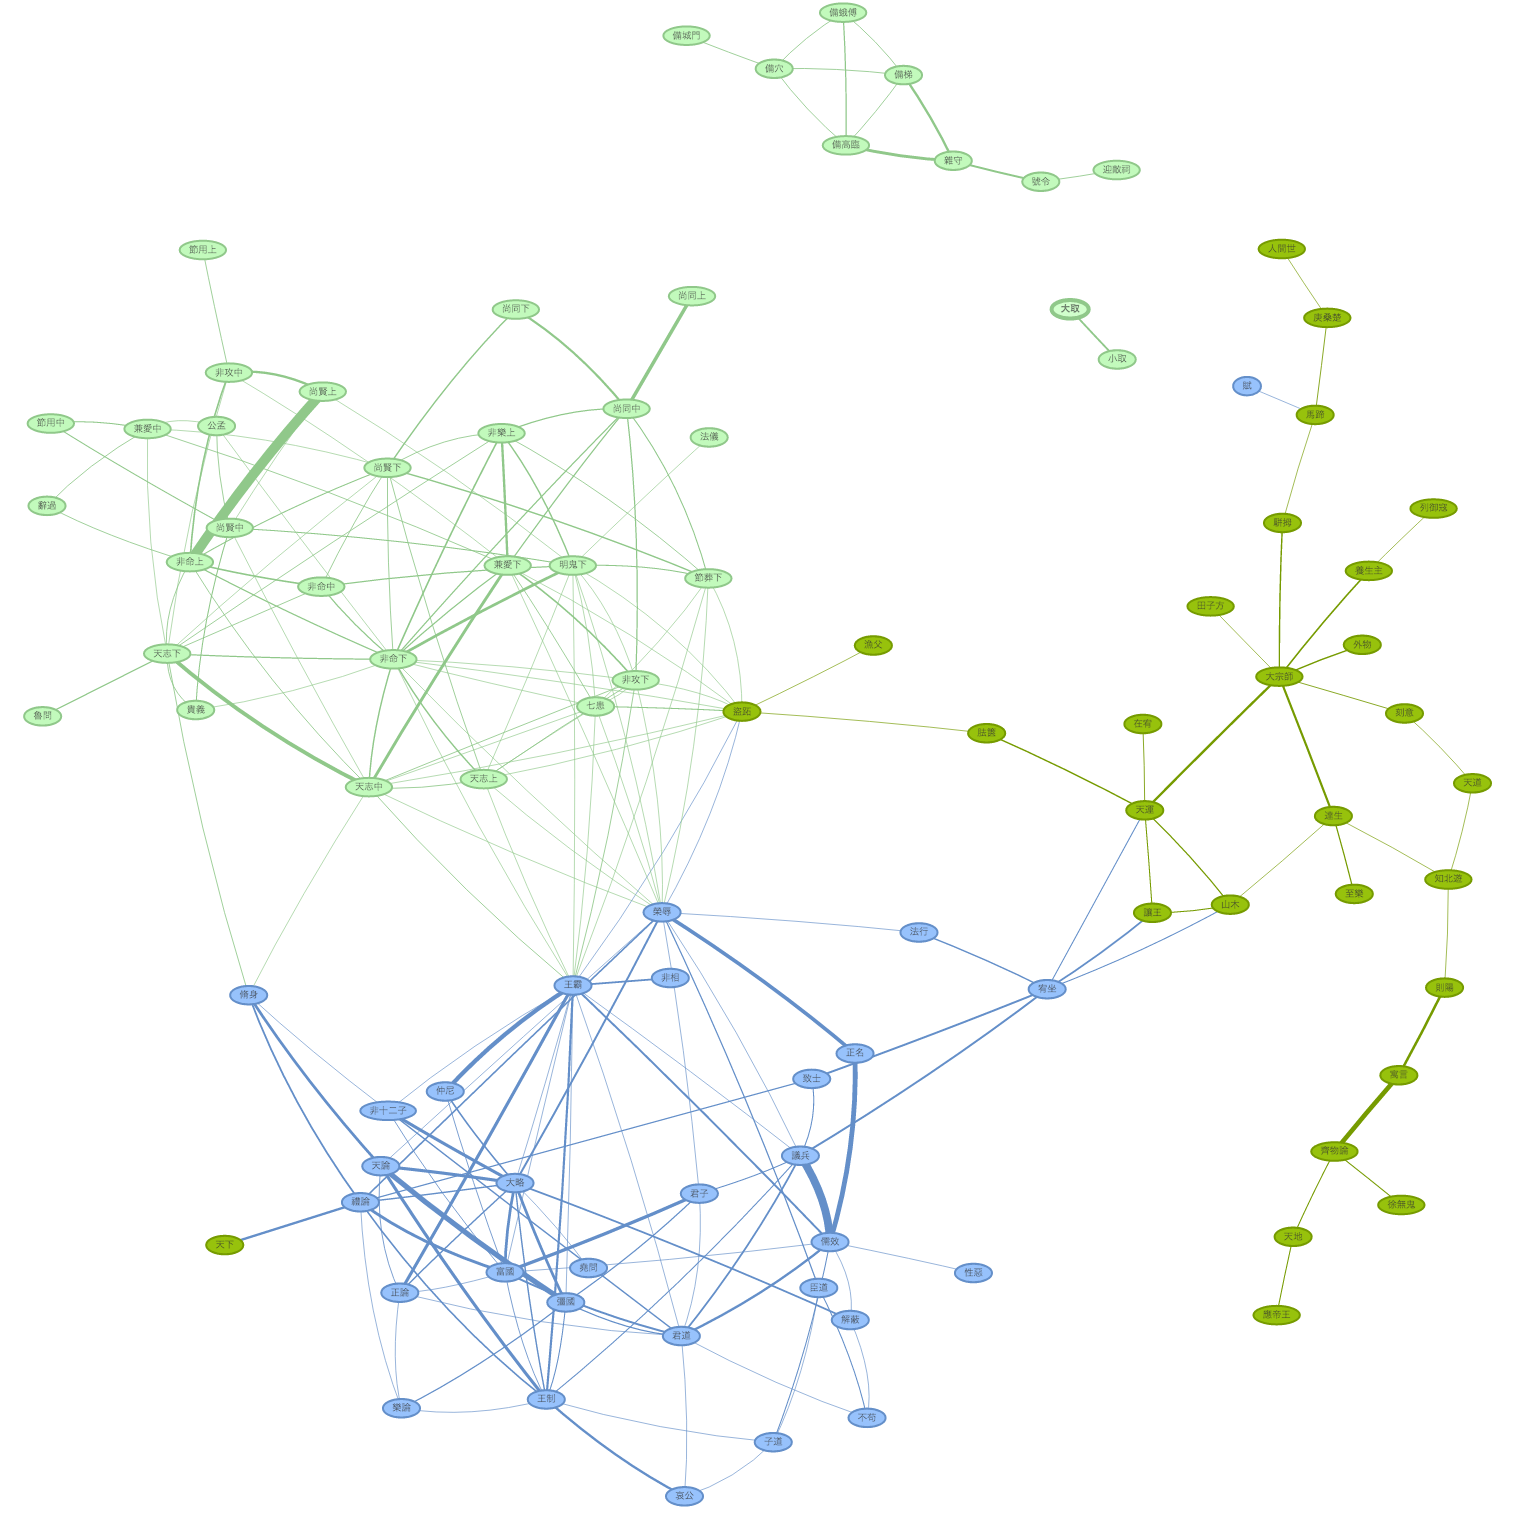
What this means is that the graph can be used as a map to see where similarities occur and with which to navigate the results. It also makes it possible to visualize broader trends in the data which might not be easily visible by looking directly at the raw data. For instance, in the following graph created using the tool from three early texts, several interesting patterns are observable at a glance (key: light green = Mozi; dark green = Zhuangzi; blue = Xunzi):
Some at-a-glance patterns suggested by this graph: chapters of the three texts tend to have stronger relationships within their own text, with a few exceptions. There are several disjoint clusters of chapters, which have text reuse relationships with other members of their own group, but not with the rest of the text they appear in – most striking is the group of eight “military chapters” of the Mozi at the top right of the graph, which have strong internal connections but none to anything else in the graph:
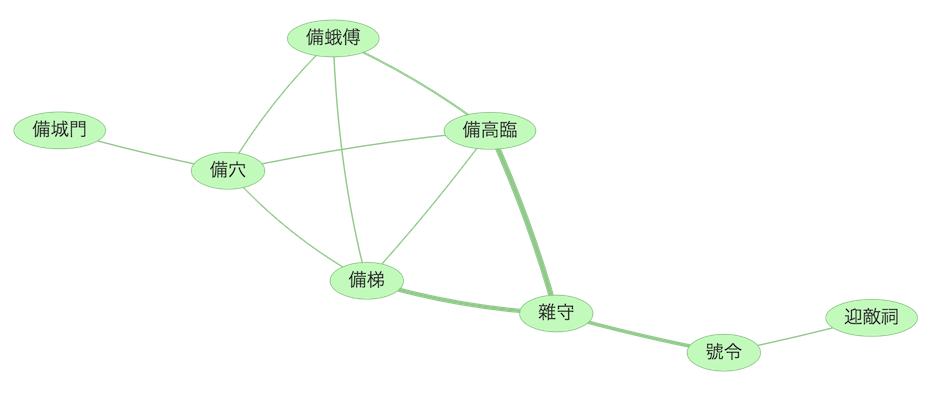
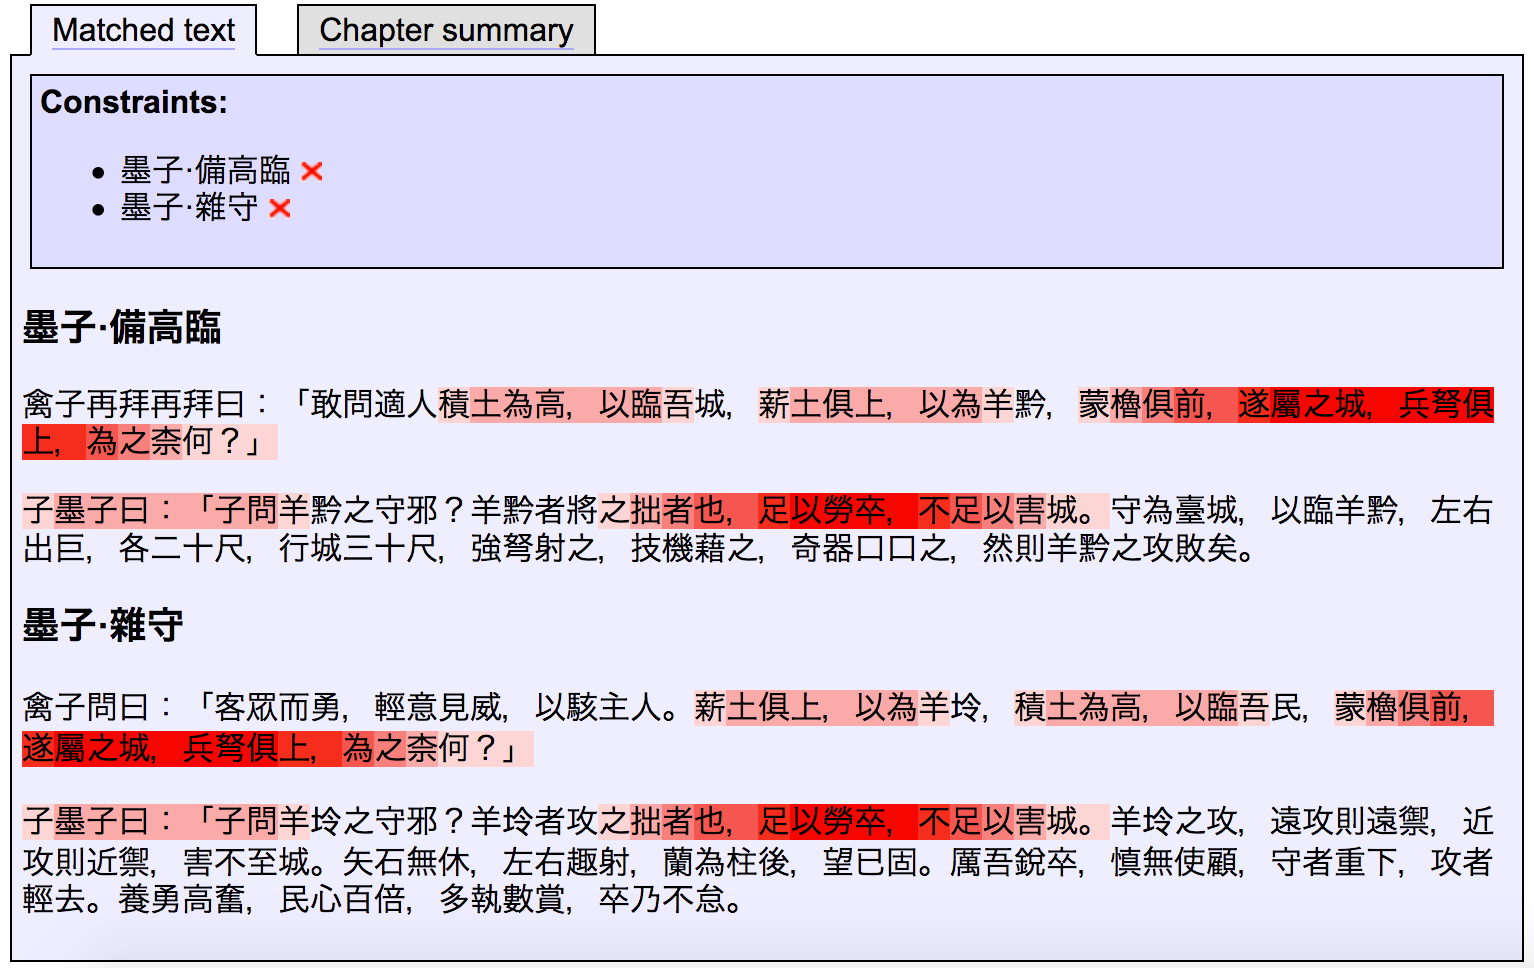
Double-clicking on some edges to view the full data indicates that some of these pairs have quite significant reuse relationships:
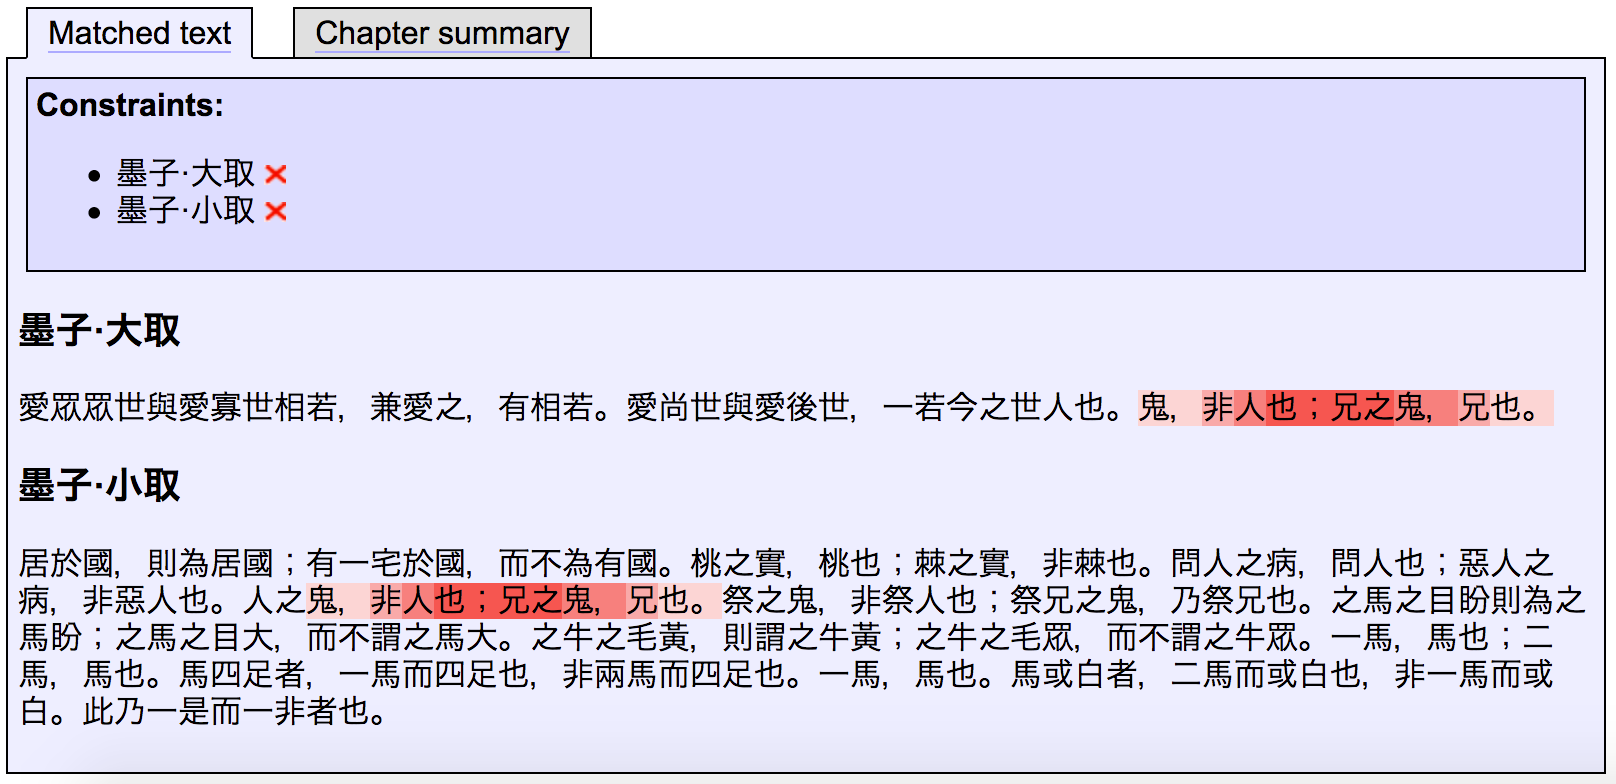
The only other entirely disjoint cluster is the group formed by the 大取 and 小取 pair of texts – in this case the edge is formed by one short but highly significant parallel:
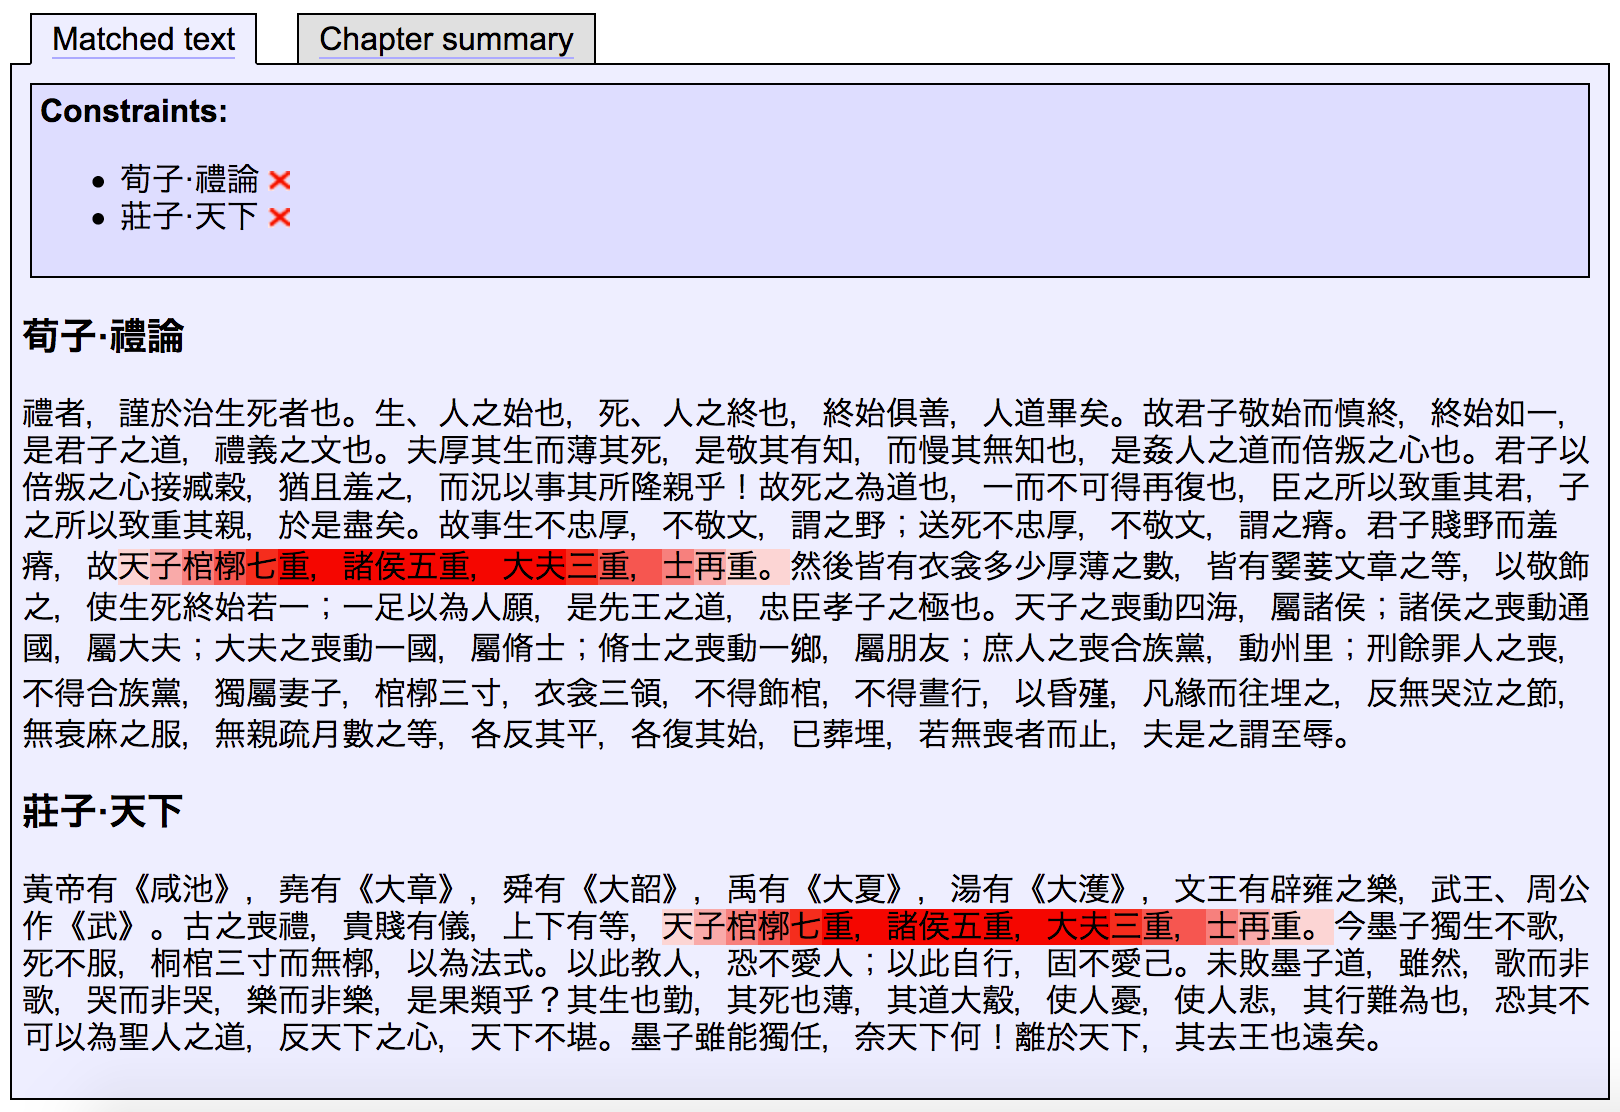
Another interesting observation: of those Zhuangzi chapters having text reuse relationships with other chapters in the set considered, only the 天下 chapter lacks any significant reuse relationship with any other part of the Zhuangzi – though it does contain a significant parallel with the Xunzi:
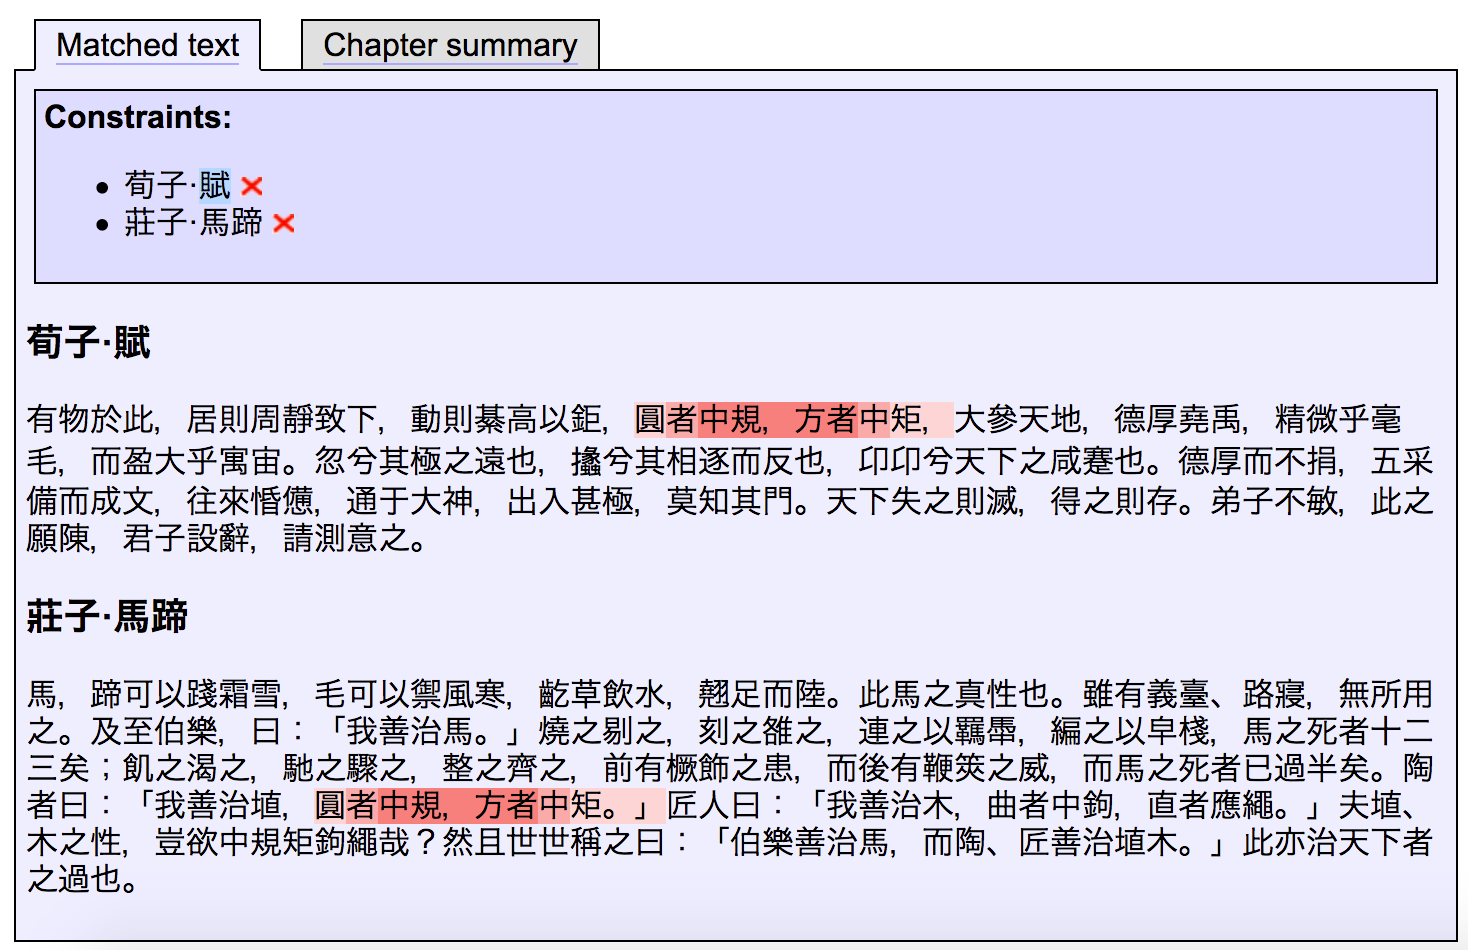
Something similar is seen with the 賦 chapter of the Xunzi:
There is a lot of complex detail in this graph, and interpretation requires care and attention to the actual details of what is being “reused” (as well as the parameters of the comparison and visualization); the Text Tools program makes it possible to easily explore the larger trends while also being able to quickly jump into the detailed instance-level view to examine the underlying text. Text Tools works “out of the box” with texts from ctext.org read in via API (ideally you will need an institutional subscription or API key to do this efficiently), but it can also use texts from other sources.
Further information:
